
Abstract
Background. Determining appropriate staffing and resources for mass gathering events (MGEs) such as college football games is challenging. Objective. We sought to create a model predictive of patient volumes at collegiate football games to help aid emergency medical services (EMS) in appropriate health care services planning. Methods. A retrospective review was conducted of patient EMS medical records from 99 Division I collegiate football games played across fourteen football seasons (2005-2018) at one outdoor stadium. A linear regression model with cross validation to the patient illness records was created, using the total number of patients as the outcome measure and variables that can be ascertained prior to game day as the predictors. Results. A formula was derived (R2 = 0.70); predicted number of patients = 1.49 + [5.91 x parking lot hours] + [1.12 x low temperature in °F] + [-12.42, if rain=yes] + [18.34, if snow=yes] + [-15.97, if opposing team rank (OTR) is 11-25; -30.48 if OTR is >25] + [-14.50, if home team rank (HTR) is 11-25; -11.52 if HTR is >25]. Conclusion. Weather data, open parking lot hours prior to kickoff, and team rankings are important variables to consider when planning for necessary medical care at collegiate football games.
Introduction
In 2019, collegiate football celebrated its 150th anniversary.1 As the nation’s second most popular sport, collegiate football drew nearly 50 million fans to games across all divisions and just under 34 million fans at Division I games alone during the 2018 season.1,2 As with any mass gathering event (MGE), along with the sport’s popularity and consequently large attendance comes the expectation of patients requiring medical care as well as the potential for a mass casualty incident. Additionally, the majority of collegiate football stadiums are outdoor, thus subjecting their patrons to various weather elements and potentially affecting patient presentation rates (PPRs, or patients per 10,000 spectators) and transport to hospital ratios (TTHRs, or patients per 10,000 spectators transported from the event to the hospital via ambulance).
While the determination of appropriate staffing and resources necessary for any MGE is challenging, collegiate EMS agencies in particular face unique challenges in attempting to plan adequate staffing for certain MGEs such as football games. Not only do collegiate EMS agencies tend to have higher staff turnover rates based on the natural time constraints immanent in hiring primarily college students, but both student organizers and medical providers at collegiate MGEs also tend to be relatively inexperienced in comparison to other prehospital providers.3 These characteristics further necessitate the need for an accessible model to predict patient volumes at collegiate football games so prehospital providers can prepare for appropriate event staffing and resource utilization.
Factors previously described in the literature known to affect patient volumes at MGEs, though not specific to collegiate football games, include weather, event type, event duration, event location (indoors or outdoors), time of day, day of week, patient age distribution, crowd mood and density, crowd intention, event attendance, and alcohol and drug use.4-8 Additionally, the crowds drawn to football games tend to require more medical attention than do less-animated spectators attending non-sporting events.9 Two studies have proposed models predictive of patient volumes at collegiate football games based on temperature alone, though none to our knowledge have attempted to perform a stepwise regression utilizing multiple variables, nor have any utilized only predictable factors easily accessible to event planners prior to the day of the event.10,11
This study aimed to create a model predictive of patient volumes at collegiate football games using only variables accessible to event planners prior to game day in an attempt to better explain variability of PPRs and TTHRs, improve overall resource utilization, and enhance staffing efficiency at MGEs.
Methods
Beaver Stadium EMS operations
This study analyzed data from ‘home’ football games at Beaver Stadium located at Pennsylvania State University (Penn State) in University Park, PA. On football game days, all local 911 calls are re-directed to central dispatch in the stadium itself. The EMS dispatcher communicates with stadium EMS personnel after each 911 call and dispatches the appropriate basic life support (BLS), advanced life support (ALS), or BLS utility team based on pre-defined coverage areas. The stadium has one central First Aid station composed of a small waiting room and twelve individual patient ‘rooms’ which can accommodate up to eighteen patients on stretcher beds. This First Aid area serves as the base station for all football EMS operations and is typically staffed by at least one nurse and one physician. Any patients within the stadium who necessitate further assessment/care or require hospital transport are first transported from within the stadium to the First Aid station by one of approximately 17 BLS teams (number of teams may vary based on expected patient volumes) or five ALS teams. Additionally, one of the three agency ambulances is always kept in the stadium’s South tunnel in the event a participating athlete suffers an injury requiring hospital transport. Each BLS team is equipped with a basic first aid kit and a Stryker stair chair, while ALS teams are each equipped with an oxygen tank, ambulatory monitor, and full transport stretcher. Any patients in the tailgate fields surrounding the stadium who require EMS attention either before or during the football game are typically assessed by one of five BLS utility teams, which are equipped with a basic first aid kit, Stryker stair chair, and patient stretcher. These patients are then transported by the utility team to the First Aid station for further care or for ambulance transport to the hospital.
On game days, the collegiate EMS agency staffs many BLS teams and some utility teams with both paid and volunteer crew members. Additionally, a significant portion of staff on these days (ALS teams, some BLS teams, some utility teams, and area supervisors) are paid staff members from other local EMS agencies. Medical students, resident physicians, and attending physicians from the Penn State Milton S. Hershey Medical Center in Hershey, PA also staff each game.
Data collection
Study data was collected for all 99 regular season ‘home’ football games played by the Penn State Division I collegiate football team at outdoor Beaver Stadium in University Park, PA between 2005 and 2018. The football seasons ran from late August to November of each year. Of note, alcohol is permitted in tailgate areas but prohibited within Beaver Stadium itself.
The patient data used for this study was collected by Beaver Stadium EMS staff through handwritten patient charts, then later de-identified and entered into a Microsoft Excel spreadsheet. All patients who sought medical attention, regardless of age or chief complaint, were included in the study.
Following patient data compilation, we retrospectively gathered weather data, team ranking data, and parking lot hours for each game, hypothesizing that these variables might play a role in patient volume prediction. Weather data, including daily high and low temperatures (in degrees Fahrenheit) and precipitation (rain or snow), were collected from the Penn State Department of Meteorology Joel N. Myers Weather Center website (http://www.meteo.psu.edu/~wjs1/wxstn/). Penn State and opposing team Associated Press Poll rankings, based on the week each game was played, were gathered from the Entertainment and Sports Programming Network’s website (https://www.espn.com/) and confirmed using data from Sports-reference.com. Team rankings were further stratified into three groups: 1-10, 10-25, or >25; the >25 group included all teams that were unranked at the time of each game. Games in which Penn State played any team included in the Big Ten Conference were considered “in conference” games. Finally, the number of open parking lot/tailgate hours prior to kickoff was calculated based on game kickoff time. Per Penn State tailgate regulations, unless otherwise specified tailgate lots always open at 7:00am on days with a noon kickoff time and at 8:00am on days with all other kickoff times.
Statistical analysis
This study was approved by the Institutional Review Board at Pennsylvania State University’s College of Medicine. Statistical analysis system (SAS) software (version 9.4) was utilized to fit a linear regression model with cross validation to the patient medical records using several variables: parking lot hours, daily high and low temperatures, precipitation, team rankings, and conference designation. A linear forward stepwise regression model was utilized with a selection removal and entry criteria of 0.15 and a five-fold cross-validation method, reviewing the predicted residual sum of squares at each step. Statistical significance was set at p < 0.05. Since we only had access to accurate attendance data for four of the 14 football seasons in our data set, we employed the total number of patients as our primary outcome measure rather than PPRs or TTHRs.
Results
Over a period of 14 football seasons, 99 games were played against opposing teams in Beaver Stadium. Of 5,384 total patients, 55% were male and 45% were female. Patient ages ranged from less than one year to 92 years old, with a mean age of 35 years old. Most patients were seen within three hours after kickoff (62.4%), though several were seen prior to kickoff (29.0%) and few were seen after the game had ended (8.6%). Alcohol intoxication was the most frequently documented chief complaint, followed by musculoskeletal injuries and head, eyes, ears, nose, and throat (HEENT) injuries (Supplementary Figure 1; Supplementary Table 1). The vast majority of patients (92%) were spectators, and most were not Penn State students (65%). Most patients were ambulatory upon arrival to the First Aid room (73%), though some arrived via ambulance stretcher (14%) or wheelchair (13%). Approximately one third of patients departed via ambulance (29%), though most were ambulatory (59%) and in minor condition (78%) upon discharge. Only 21% and 1% of patients were discharged in moderate or severe conditions, respectively. Those that were ambulatory on discharge were given instructions to follow up with their primary care provider. Additionally, 3% were referred directly to the hospital but transported via private vehicle rather than by ambulance (‘Hospital Referrals’ column in Supplementary Table 2).
Figure 1. Predictive model of patient volumes at Beaver Stadium, excluding three outlier games
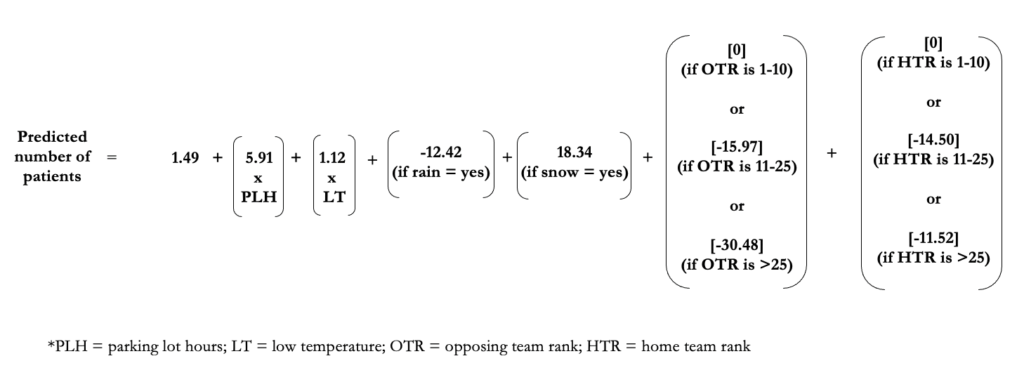
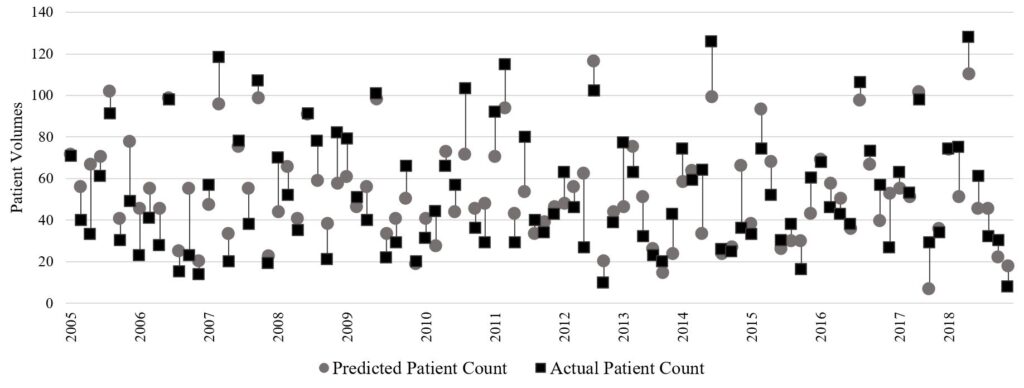
SAS initially determined that all variables except for conference designation were predictive of patient volumes in a linear forward stepwise regression model (R2 = 0.64). The model’s predicted patient volumes fell within 1 standard deviation (SD) (SD = 17.9) of actual patient volumes 72% of the time (71 games), and within 2 standard deviations of actual patient volumes 97% of the time (96 games). Subsequent stepwise regression analysis was run following removal of three outliers, each deviating at least three standard deviations from the mean. In this new model (Figure 1) (R2 = 0.70), opposing team rank, number of parking lot hours, and daily low temperature were the most highly significant predictors (p < 0.0001), followed by snow (p < 0.01), Penn State rank (p < 0.01), and rain (p < 0.05). Refer to Figure 2 for a depiction comparing the actual patient volumes for each game to the volume predicted by our model and to Supplementary Figure 2 for a residual plot of predicted vs. actual patient count differences. The individual data for each game can be found in Supplementary Table 2.
Figure 2. Comparison of predicted patient volumes to actual patient volumes at each Beaver Stadium football game from 2005 to 2018
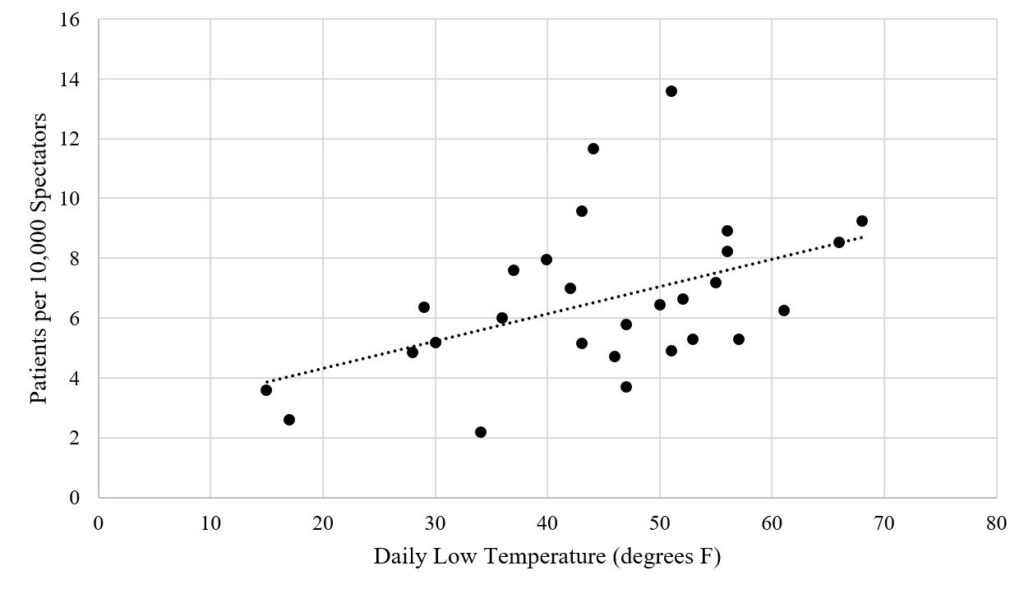
All individual variables considered in the development of this model were also examined separately as single predictors, and several linear trends were noted. Patient volumes and PPRs tended to increase along with rising temperatures (Figure 3; Figure 4) (R2 = .37, p = 0.0002). Daily low temperature was more predictive of patient volumes in our model than daily high temperature. The mean number of patients at games with a low daily temperature below 30°F (n = 11) was 36 (median = 29) compared to a mean of 76 patients (median = 74) on days with a daily low temperature above 60°F (n = 12) (p = 0.008). Games in which the opposing team’s rank was 10 or lower were associated with the highest patient volumes; the mean number of patients for these games was 98 (median = 104) compared to means of 66 and 48 (medians = 61, 41) for games played against opposing teams in the 10-25 and >25 (unranked) categories, respectively (p < 0.001). A similar yet not statistically significant association was noted between Penn State’s team rank and patient volumes, increasing slightly with improved ranking (p = 0.23). Patient volumes were also positively associated with number of parking lot hours (p < 0.001). By contrast, patient volumes were inversely related to precipitation: games with rain averaged 50 patients (median = 39) (p = 0.04) and games with snow averaged 43 patients (median = 35) (p = 0.027), compared to 62 and 56 patients on average (medians = 62, 52) during games without any rain or snow, respectively. Conference was not found to have any association with patient volumes (p = 0.35). Of note, the variance inflation factors for all independent variables were very low, confirming that none were highly correlated with each other.
Figure 3. Relationship between patient volumes and daily low temperature, for all seasons (2005 to 2018)
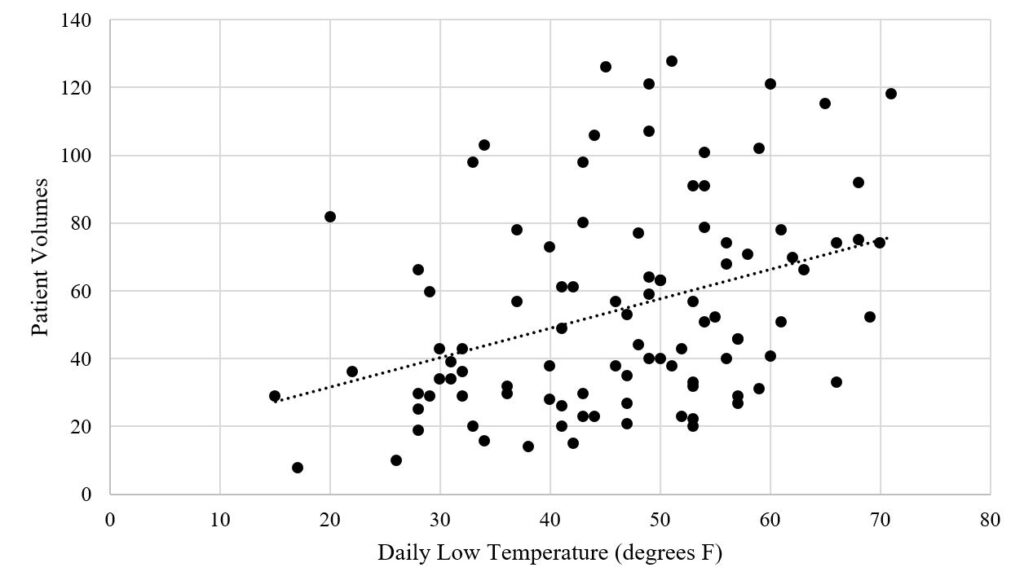
Figure 4. Relationship between patient presentation rates (PPRs) and daily low temperature, for seasons with attendance data (2015 to 2018)
Discussion
A mass gathering event (MGE) is considered to be any event (planned or unplanned) where the attendance is sufficient to strain the planning and response resources of its host. The medical care provided to patients at these events including football games has been termed ‘mass gathering medical care’ (MGMC) by the National Association of EMS Physicians.10,12,13 Though few prior studies have attempted to erect a model predictive of patient volumes at collegiate football games specifically, several studies have attempted to build models predictive of patient volumes at various other types of MGEs such as other sporting events, music festivals, outdoor concerts, agricultural shows, and auto racing events.
The Zeitz method, based on one recurrent Australian agricultural event, suggests day of the week as a factor influencing patient volumes.5 The vast majority of collegiate football games, however, are played on the same day of the week, Saturday, with rare Friday evening games. The Arbon method, based on several Australian events in one calendar year, suggests crowd mobility, daily average humidity, presence of venue boundaries, whether the event involves sports, whether the event occurs during day or night, and whether the event is held indoors or outdoors as variables affecting patient volumes.6 Additionally, this model suggests that predicting patient load at MGEs is a nonlinear problem; for example, temperature seems positively correlated with patient volumes up to a certain point, above which patient volumes then decrease, presumably due to extra precautions taken by spectators in more extreme weather conditions.6 A later expansion of the Arbon method also incorporated attendance and patient age distribution as inputs in the model, though both must be estimated prior to game day as it is impossible to accurately ascertain them until after the event.5 Comparatively, the Hartman model does not utilize regression modeling but rather stratifies events into three different severity classes based on various event characteristics including heat index, presence of alcohol, crowd age, crowd attendance, and crowd intention.7
Despite these various attempts to predict PPRs and identify factors contributing to patient volumes, no widely accepted predictive model exists and thus most staffing and resource requirements at MGEs remain solely based on “local experience and anecdotal knowledge.”14 While understaffing an event can increase risks to spectators by delaying their access to emergency care, consistently overstaffing events can become unsustainably expensive for institutions and their EMS agencies.3 Collegiate EMS agencies in particular face unique challenges in attempting to plan adequate staffing for certain MGEs such as football games. Many, if not most, event planners and organizers at collegiate EMS agencies are students. Therefore, by nature they are often less experienced in MGE planning than their counterparts at larger institutions. The high turnover rates and relative inexperience of student organizers and medical providers at collegiate MGEs necessitates a more accessible and accurate model to predict patient volumes and plan event staffing and resources.3 By examining data from several football seasons at a large collegiate stadium with a well-established EMS system, we were able to erect a model predictive of patient volumes which has the potential to help collegiate football event planners efficiently appropriate resources in advance of games.
Our original model underpredicted patient volume by more than 40 patients on two notable occasions: the Ohio University game in 2012 and the Michigan game in 2013. As these unique instances representing two of the three outliers across all our data coincided with major University-related events, patient volumes were likely influenced by social factors not taken into consideration by our model. The Ohio University game in 2012 was the first game played following the death of former longtime coach Joseph Paterno, with his successor Bill O’Brien serving as the new team coach. The 2013 Michigan game was a homecoming ‘white out’ game that Penn State won in four overtime periods despite its evening kickoff and subpar weather conditions. The third outlier was the Georgia State game in 2017, for which the model overpredicted by 38 points, likely due in part to a combination of Greek Life recruitment events, adverse weather conditions, and a string of several games in which Penn State had won by more than two touchdowns. For these reasons, we recommend taking into consideration major local, campus, and/or social factors that may influence attendance at any particular event. Initially erected to aid in the evaluation of factors contributing to injuries at one single event, Haddon’s matrix may be useful in identifying social factors that contribute to event injuries as well as their interplay with other (individual, equipment, physical environment, and timing) event-related factors.15-17
Our analysis demonstrated that patient volumes tend to increase as temperature and parking lot hours increase, while volumes decrease with precipitation and opposing and ‘home’ team ranking numbers. Prior studies have shown an association between patient volumes and indicators of temperature and humidity such as heat index and dew point.18 While this data could be estimated prior to game day using predicted temperature and humidity, lack of access to historical humidity data prevented us from including these calculations in our model. Similarly, one published algorithm included expected attendance from ticket sales in its calculations of predicted patient volumes, and several other models incorporate some estimate of attendance.19 Despite our access to attendance rates for four football seasons, we excluded attendance as a factor in our model as it could not be accurately predicted prior to game day. For the seasons in which we had both expected attendance based on announced ticket sales and actual attendance data, we found dramatic discrepancies between the number of ticket sales and the actual game attendance (Supplementary Table 2). Forecasted weather data, as well as weekly team rankings and parking lot hours, are all consistent factors that any event planner should have access to at least one week prior to game day.
Several prior studies have demonstrated a positive relationship between temperature and patient volumes, both at collegiate football games and other MGEs. Kman et al. describe a nonlinear association between patient volumes and temperature at collegiate football games, observing a higher increase in expected number of patients for every 1 degree increase in temperature at higher temperatures.10 In a supplementary analysis, we found the validity of their model to significantly diminish below recorded temperatures of approximately 25°F. For a hypothetical game with 100,000 spectators at 30°F, their model predicts 79 patients. For the same number of hypothetical spectators at 20°F and 10°F, however, it predicts 642 and 18,231 patients, respectively. This phenomenon might be explained by the exponential nature of their model and its utilization of temperatures recorded during each game’s half time as its sole predictive variable; the half times during which a temperature was recorded all occurred between the hours of 12:40 and 20:40, and the lowest reported temperature for a game at either stadium in their data set was 38 degrees Fahrenheit.10 While our study found a positive relationship between temperature and patient volumes, it remains unclear why daily low temperature was more predictive of patient volumes in our model than daily high temperature. One could hypothesize this phenomenon may be partly due to the relation between the daily low temperature tending to occur around sunrise and the percent of games with noon kickoffs (42.4%) where potential patients are participating in tailgate festivities earlier in the day.
In examining other weather data to include in our analysis, we originally combined both ‘rain’ and ‘snow’ into a general binary ‘precipitation’ variable. However, in separating that variable into ‘rain’ and ‘snow’ we discovered that our individual ‘rain’ variable was identical to our ‘precipitation’ variable because our data set did not include any games with snow but without rain. Therefore, we elected to include a ‘snow’ variable despite its lack of individual significance in an effort to improve generalizability across several EMS systems in different states with different baseline precipitations. Within our own data set, for example, we found that heat-related complaints were much more common in games without precipitation while hypothermia was more common in games with precipitation. Our hope is that inclusion of both ‘rain’ and ‘snow’ as separate variables, despite their synchronicity in our own data set, will allow our equation to more accurately predict patient volumes at both Northern programs with high annual snowfall and Southern programs with little to no snowfall.
Another variable difficult to quantify yet often integral in predicting patient volumes is the presence of alcohol at an event, as well as the interplay between alcohol availability and age distribution of the event’s spectators. A well-established link exists between spectator age and alcohol in predicting patient presentations, with younger age demographics in environments that serve alcohol leading to an increased need for medical attention secondary to substance-related medical complaints.20 However, one study found that the presence of alcohol at events was not significantly associated with PPRs.21 Though we could not control for alcohol consumption in our study, alcohol intoxication was by far the most common chief complaint of all patients in our data set. The mean age amongst those patients was 26 years old and the median was 21 years old, suggesting that half of patients treated for alcohol intoxication were under the legal drinking age, and most (75%) of those intoxicated individuals under the legal drinking age were Penn State students. Future studies could explore how the permission of stadium alcohol sales affects those statistics and implications for the medical care needed at those events as a result.
Ultimately, the goal of erecting a model predictive of patient volumes is to create a tool useful to event planners for staffing and resource allocation prior to game day. Moving forward, event planners should consider not only the staffing levels appropriate based on the predicted number of patients, but also whether that staffing level remains adequate to prevent increased response times to patient incidents within and outside of the stadium itself. Additionally, the physical setups of collegiate football stadiums differ widely; though ours is arranged in a way that allows for easy access to and rapid transport of patients from any part of the stadium down to our First Aid station, not all stadiums have that luxury. For this reason, if choosing to decrease staffing levels based on a low predicted patient volume, organizations should also consider the need to adequately cover all sections of the stadium and maintain appropriate response times. We would also be interested to see how our transport to hospital ratios (TTHRs) per game (Supplementary Table 2) compare to those at similar Division I collegiate football stadiums without a First Aid station, as the original goal of implementing that treatment area at Beaver Stadium was to decrease TTHRs.
Limitations
Our predictive model is based on data from one collegiate football stadium and thus may be limited in predicting patient volumes at other Division I outdoor collegiate stadiums with different EMS infrastructures. Many variables could not be controlled for in this study, including number and age of spectators, environmental factors beyond temperature and precipitation, and consumption of alcohol. While alcohol has traditionally been prohibited from being served within Division I National Collegiate Athletic Association events, these restrictions on alcohol sales were eliminated in 2018.22 Though alcohol remains unavailable for purchase at Beaver Stadium during football games, our model may not be predictive of patient volumes at MGEs where alcohol is served throughout the game.
Additionally, our data contained a predictable association between low temperature and snow. This underlying relationship led to our model including snow as a positive term in the equation despite the inverse relationship between snow and patient volumes. Ultimately, we decided that the improved generalizability achieved via inclusion of the snow variable outweighed any effects secondary to the variable’s inverse positivity.
Penn State also ranks amongst the highest collegiate football attendance in the country, behind only the University of Michigan; in 2018, home football games averaged an attendance of 105,485 per game.2 Comparatively, other Division I collegiate teams such as Rutgers University and Michigan State University averaged less than half of Penn State’s attendance per home game between 2013-2017, at 45,891 and 34,266 respectively.23 Thus, our results may not generalize to all Division I collegiate football teams simply due to variation in game attendance and stadium capacity. Additionally, though we did not retrospectively re-format our data to that of a minimum data set (MDS), we recognize the utility of using a MDS in future football seasons to collect patient and environmental data and standardize data collection across multiple MGEs.24,25
Conclusion
The prediction of patient volumes at collegiate football games, like other types of mass gathering events, is difficult and multifactorial. Our study suggests that examining forecasted weather data in conjunction with current team rankings may aid in this prediction. Though the use of retrospective data analysis and regression modeling lacks precision, it can help improve future patient volume prediction and aid in planning of appropriate health care services prior to collegiate football games.
Acknowledgements
We would like to thank James ‘Dave’ Jones (EMS Manager, Paramedic) and V. ‘Josh’ Fremberg (EMS Field Supervisor/Instructor, Paramedic) of the Penn State University Ambulance Service (UAS) for their assistance in accessing and interpreting the data utilized for this project. We would also like to thank Jill Fremberg for her longtime efforts in patient EMS chart collection, organization, and consolidation on football game days; William ‘Wes’ Cartwright (Paramedic, former UAS EMS Supervisor) for his many years of service and significant contributions to the practice of collegiate event medicine; Tiffany Spiroff-Walstrom (UAS EMS Supervisor, Paramedic) for her continued service and contributions to the practice of collegiate event medicine; all past and current members of the Penn State University Ambulance Service and all other Beaver Stadium EMS staff members for their efforts in data collection and contributions to the practice of collegiate event medicine. Funding was not obtained for this research, nor do the authors have any conflicts of interest to disclose.
References
-
2018-19 report: Amazing college football popularity highlighted by impressive ratings and attendance data (2019). National Football Foundation. https://footballfoundation.org/news/2019/6/11/2018-19_Attendance_Release.aspx. Published June 11, 2019.
-
2018 Football Attendance. NCAA. http://fs.ncaa.org/Docs/stats/football_records/Attendance/2018.pdf. Published 2018.
-
Ordway EC, Sarna N, DeGeorge LM, Baird AM, Reid MJ, Nable JV. EMS resource utilization at college campus mass gathering events. J Coll Emerg Med Serv. 2018;1(2):24-30.
-
Milsten AM, Maguire BJ, Bissell RA, Seaman KG. Mass-gathering medical care: A review of the literature. Prehosp Disaster Med. 2002;17(3):151-62. doi: 10.1017/s1049023x00000388
-
Zeitz KM, Zeitz CJ, Arbon P. Forecasting medical work at mass-gathering events: Predictive model versus retrospective review. Prehosp Disaster Med. 2005;20(3):164-168.
-
Arbon P, Bridgewater F, Smith C. Mass gathering medicine: a predictive model for patient presentation and transport rates. Prehosp Disaster Med. 2001;16(3):150-158.
-
Arbon P, Bottema M, Zeitz K, Lund A, Turris S, Anikeeva O, Steenkamp M. Nonlinear modelling for predicting patient presentation rates for mass gatherings. Prehosp Disaster Med. 2018;33(4):362-367. doi:10.1017/S1049023X18000493
-
Hartman N, Williamson A, Sojka B, Alibertis K, Sidebottom M, Berry T, Hamm J, O’Connor RE, Brady WJ. Predicting resource use at mass gatherings using a simplified stratification scoring model. Am J Emerg Med. 2009;27(3):337-43. doi: 10.1016/j.ajem.2008.03.042
-
Locoh-Donou S, Guofen Y, Welcher M, Berry T, O’Connor RE, Brady WJ. Mass-gathering medicine: a descriptive analysis of a range of mass-gathering event types. Am J Emerg Med. 2013;31(5):843-6. doi: 10.1016/j.ajem.2013.01.016
-
Kman NE, Russell GB, Bozeman WP, Ehrman K, Winslow J. Derivation of a formula to predict patient volume based on temperature at college football games. Prehosp Emerg Care. 2007;11(4):453-7. doi:10.1080/00207450701537043
-
Winslow JE. Retrospective review of relationship between spectator illness and temperature at division I football games. Ann Emerg Med. 2005;46(3):30.
-
Jaslow D, Yancy A, Milsten A. Mass gathering medical care: Position paper for National Association of EMS Physicians. Prehosp Emerg Care. 2015;4(4):359-60.
-
Emergency Preparedness Team. Public health for mass gatherings: key considerations. World Health Organization. https://www.who.int/publications/i/item/public-health-for-mass-gatherings-key-considerations. Published January 1, 2015.
-
Zeitz KM, Schneider BN, Jarrett D. Mass gathering events: Retrospective analysis of patient presentations over seven years at an agricultural and horticultural show. Prehosp Disaster Med. 2001;585:1-14.
-
Haddon W. On the escape of tiger: An ecologic note. J Am Public Health Nations Health. 1970;60(12):2229-2234.
-
Arnold J. The London bombings and the Haddon matrix. Prehosp Disaster Med. 2005;20(5):278-281.
-
Hutton A, Savage C, Ranse J, Finnell D, Kub J. The use of Haddon’s matrix to plan for injury and illness prevention at outdoor music festivals. Prehosp Disaster Med. 2015;30(2):175-183.
-
Perron AD, Brady WJ, Custalow CB, Johnson DM. Association of heat index and patient volume at a mass gathering event. Prehosp Emerg Care. 2005;9(1):49-52.
-
Nable JV, Margolis AM, Lawner BJ, Hirshon JM, Perricone AJ, Galvagno SM, Lee D, Millin MG, Bissel RA, Alcorta RL. Comparison of prediction models for use of medical resources at urban auto-racing events. Prehosp Disaster Med. 2014;29(6):608-613.
-
Bullock M, Ranse J, Hutton A. Impact of patients presenting with alcohol and/or drug intoxication on in-event health care services at mass-gathering events: An integrative literature review. Prehosp Disaster Med. 2018;33(5):539-542.
-
Locoh-Donou S, Yan G, Berry T, O’Connor R, Sochor M, Charlton N, Brady W. Mass gathering medicine: Event factors predicting patient presentation rates. Intern Emerg Med. 2016;11:745-752.
-
Executive Regulations – Administration of NCAA Championships – Availability of Alcoholic Beverages, Division I Proposal 2017-122. NCAA Legislative Services Database. https://web3.ncaa.org/lsdbi/search/proposalView?id=101871. Published April 25, 2018.
-
CollegeFootballNews.com. 2018 attendance rankings: Five-year average. College Football News. https://collegefootballnews.com/2018/02/college-football-attendance-rankings-five-year-biggest-average. Published February 16, 2018.
-
Ranse J, Hutton A, Turris SA, Lund A. Enhancing the minimum data set for mass-gathering research and evaluation: An integrative literature review. Prehosp Disaster Med. 2014;29(3):280-289. 25. Hutton A, Ranse J, Gray KL, Turris SA, Lund A, Munn MB. Environmental influences on patient presentations: Considerations for research and evaluation at mass-gathering events. Prehosp Disaster Med. 2019;34(5):552-556.
Supplementary Materials
Supplementary Materials 1 (Supplementary Table 1, Supplementary Figures 1-2): Download PDF
Supplementary Materials 2 (Supplementary Table 2): Download Excel File


